The UX of AI: how I built a custom agent to lower my power bill (and win an argument)
How to apply UX Intelligence to agentic AI—building solutions grounded in user empathy and UX best practices
TL;DR
I built an AI tool to automate the soul-crushing task of analyzing a power bill. Why? To prove UX Intelligence scales—and to win an argument with data. Spoiler: LLMs can't do math, so I made them work with systems that can.


Let’s be honest: the best product innovations don’t always come from a roadmap meeting. Sometimes, they come from trying to win an argument.
My husband and I were staring at another astronomical Georgia Power bill. We live in a flipped house—new AC, decent insulation—but the numbers weren’t adding up. My husband, an engineer, said, “We should just use AI to figure this out. Feed the bill to ChatGPT and let it pick the best plan.”
I pushed back. “It’s not that simple. LLMs are great at reasoning, but they are notoriously bad at complex, multi-variable math. You can’t just ‘ask AI’ to solve a deterministic problem with seven different seasonal rate structures.”
We did what any two brilliant, stubborn adults would do: We turned it into an experiment. I wanted to prove that “out-of-the-box” AI would fail, but secretly, I also wanted to fix our bill.
It turns out, I was right, but also wanted to solve the problem for my husband. And that journey led me to build a fully functional AI agent using my UX Intelligence Framework.
Phase 1: the “lazy” AI test (or, why I was right)
I ran our data through the leaderboard: Gemini Pro, GPT-5.2, Claude Opus. I used a sophisticated RISEN framework prompt and gave them the raw data.
The results? Chaos.
- Math Hallucinations: The models couldn’t handle the tiered pricing logic (e.g., “first 650 kWh at rate X, next 350 at rate Y”).
- Inconsistency: One model recommended “FlatBill” for stability, while another flagged it as a rip-off for our specific usage profile.
I got to tell my husband “I told you so.” But that didn’t lower our bill. The “magic button” approach failed because it lacked context and precision.
Phase 2: UX intelligence in action
At Cloudflare, where I serve as UX Director of Content Strategy, I preach a framework I call UX Intelligence. It’s about moving beyond just “designing screens” to orchestrating how AI interacts with human needs. It follows three steps: Listen, Respond, Measure.
Step 1: Listen (the problem is bigger than me)
I dug into the research. It wasn’t just my bill. Social sentiment showed that Georgians are overwhelmed by the complexity of the 7 different rate plans. People stay on expensive “Legacy” plans because they are terrified of picking the wrong one and getting hit with a “Demand Charge” surprise.
The user need wasn’t just a chat bot. The user need was mathematical certainty wrapped in conversational advice.
Step 2: Respond (architecting the hybrid agent)
This is where I moved from “Prompt Engineering” to “AI Architecture.”
I decided to build a Hybrid Agent. I didn’t need a model to do the math; I needed code to do the math and a model to explain it.
- The Math: JavaScript running on Cloudflare Workers. Hard-coded, deterministic logic for all 7 rate plans. No hallucinations allowed.
- The Brain: Llama 3 (via Cloudflare Workers AI).
- The Experience: A simple web app that parses your PDF bill, runs the math, and then uses the AI to explain why one plan is better than another in plain English.
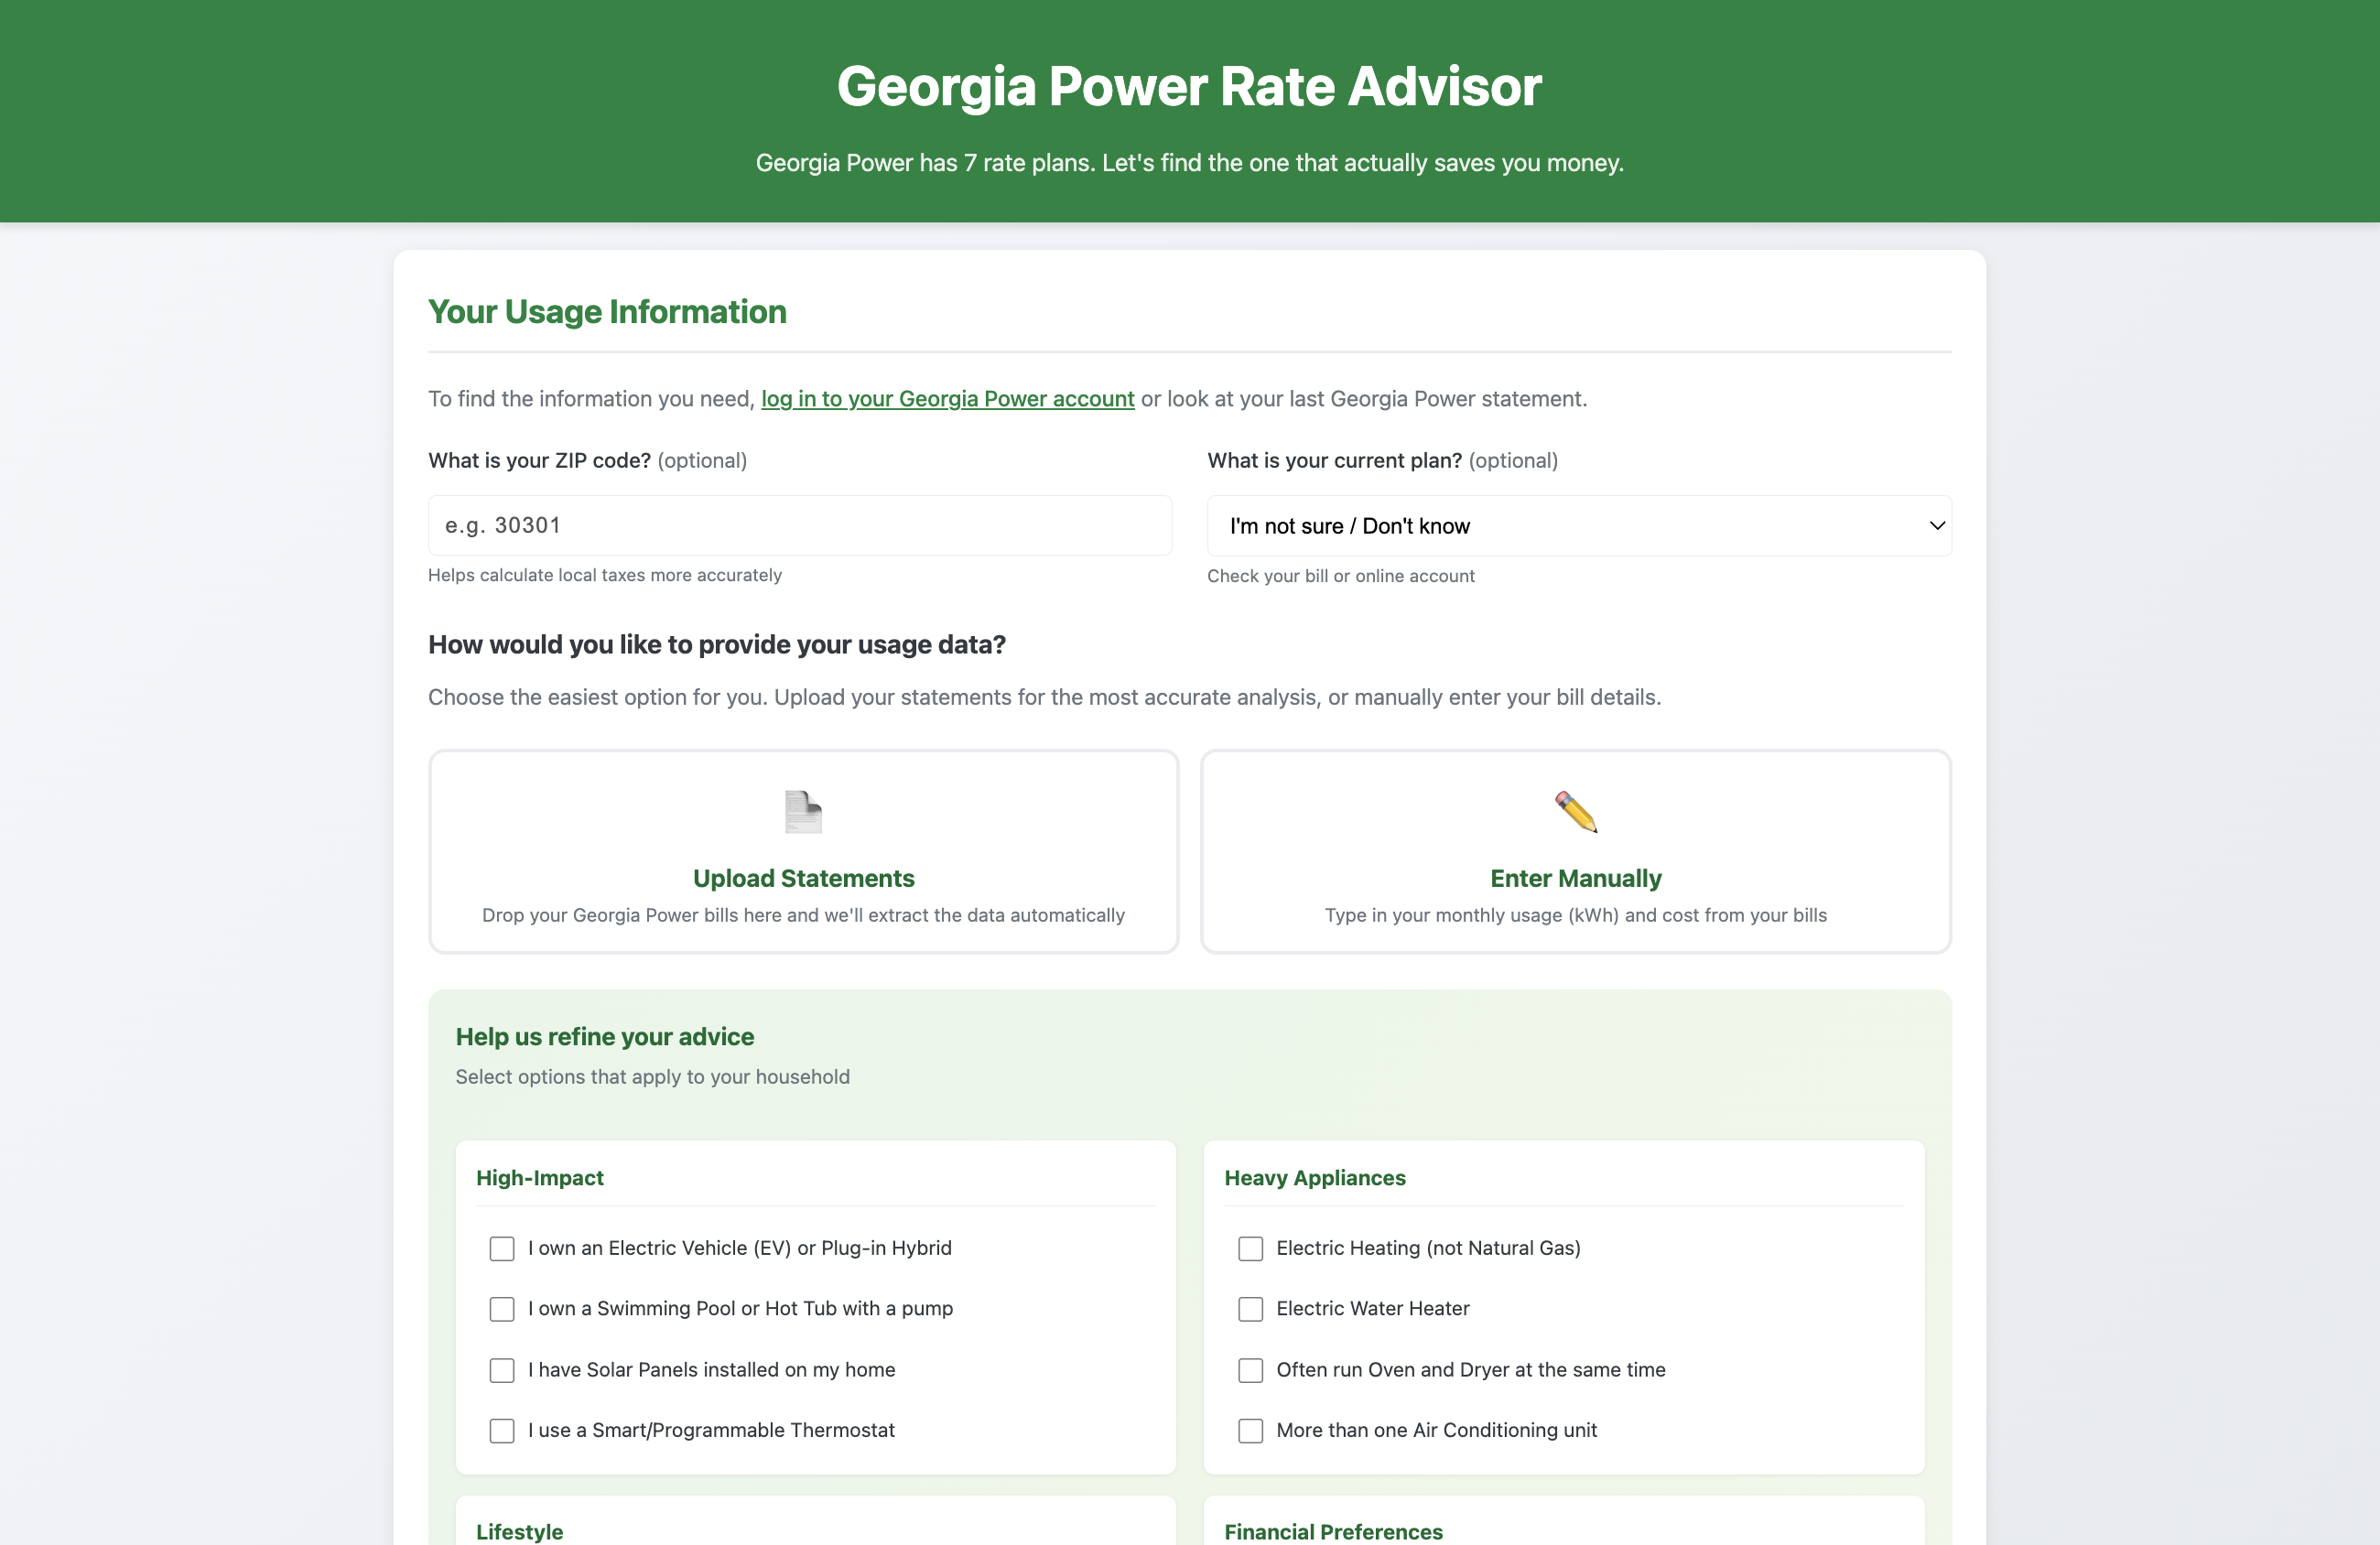 Try the Georgia Power Rate Advisor
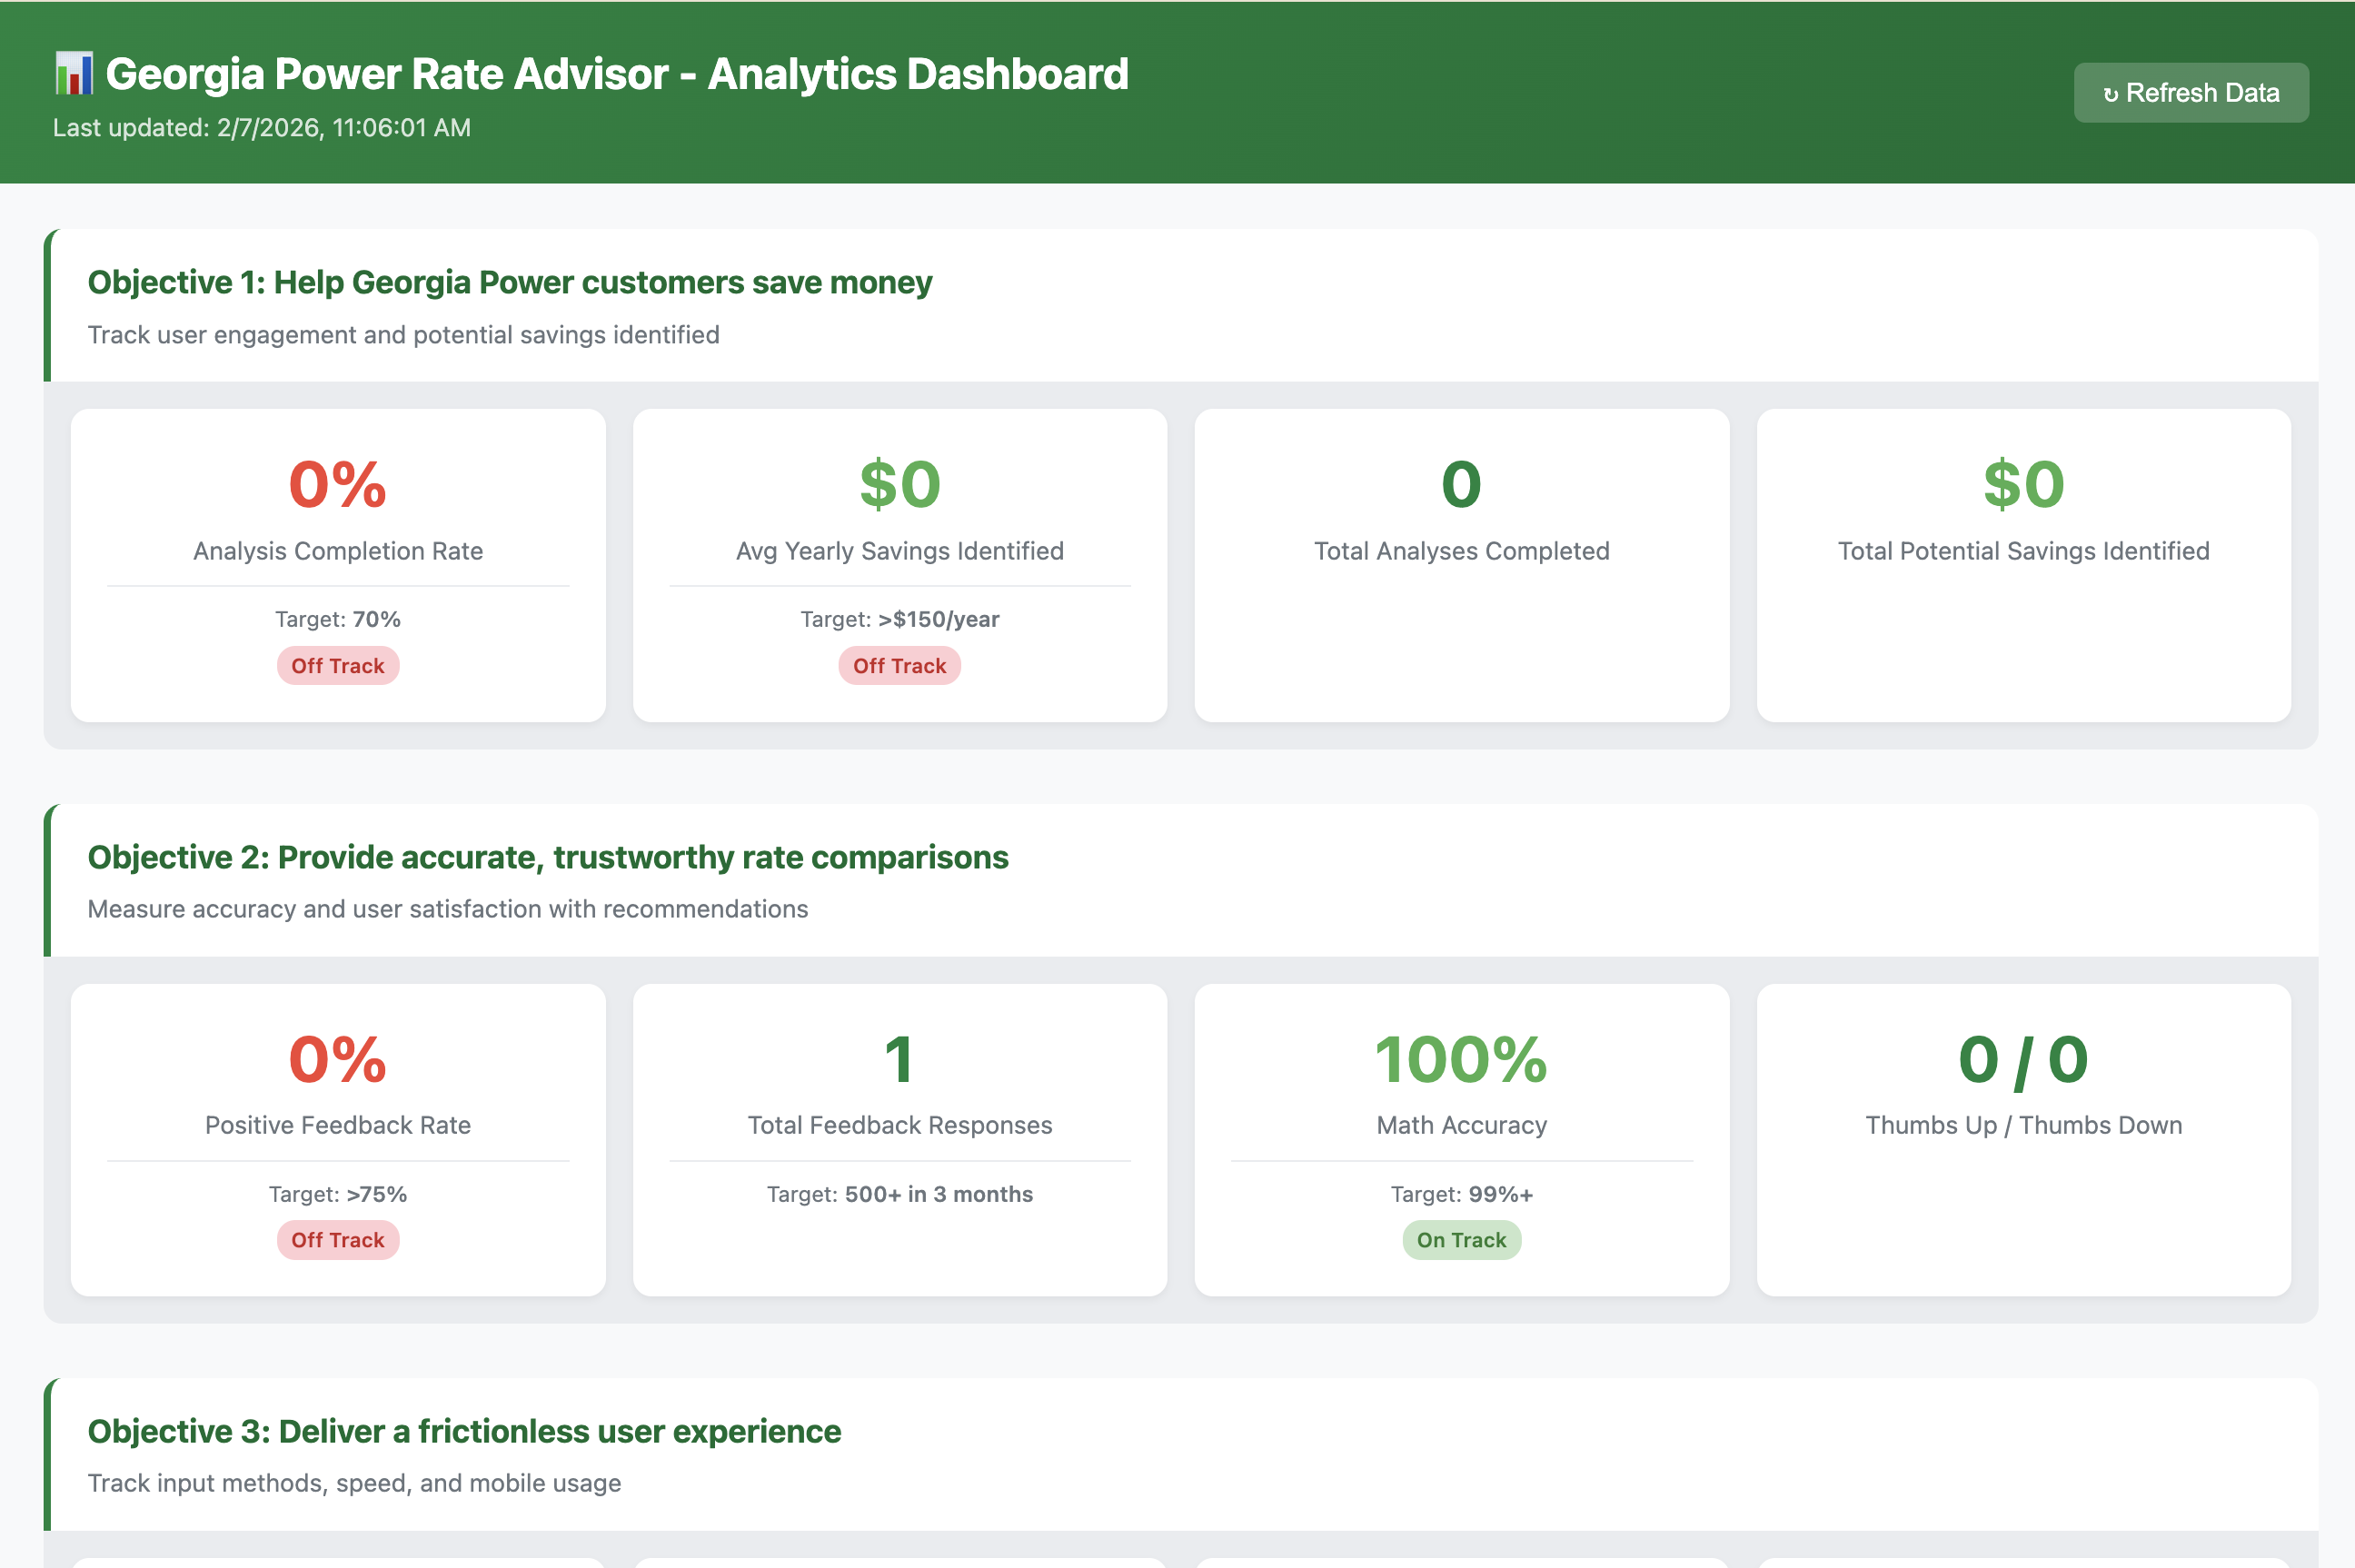
Step 3: Measure (feedback loops)
You can’t improve what you don’t measure. I set up a dashboard to track completion rates, savings identified, and user trust scores. I also implemented a feedback loop using Cloudflare KV. If a user says a recommendation wasn’t helpful, that data is stored to fine-tune the system. The agent gets smarter the more it’s used.
Deliberate UX considerations: solving for the unknown
A functioning MVP is not a usable product. Because of my experience with UX AI, I knew I had to deliberately solve for specific variables that often kill user adoption. This wasn’t just about getting the math right; it was about orchestrating trust, transparency, and cognitive ease.
Here are the specific variables I solved for:
Information architecture & user guidance
- Dashboard vs. Chatbot: Users often don’t know what to ask. A chatbot puts the burden on them. I chose a structured dashboard with guided inputs to remove that cognitive load.
- Progressive Disclosure: We start simple (upload or manual entry) and only reveal complexity (profile options, detailed results) once the user is committed.
- Two Input Paths: I didn’t want to force a single method. Users can upload a PDF (easy) or use manual entry (fallback).
- Pre-populated Defaults: If a user doesn’t know their current plan, the system works with reasonable assumptions so they don’t hit a wall.
Reducing cognitive load
- 7 Plans Simplified: Users don’t need to understand the tariff codes. They just see a ranked list.
- Lifestyle Fit Badges: Instead of complex scoring, I used “Good/Better/Best” badges which are instantly parseable.
- Bill Insights Auto-detection: The system identifies anomalies (spikes, high usage) so users don’t have to analyze their own bills.
- Single CTA: “Find My Best Plan” — one clear action to take.
Trust & transparency
- Confidence Score Breakdown: Users can click to see exactly how confidence was calculated, and actionable steps to improve it.
- “Why This Fit?”: The AI doesn’t just say “Switch.” It explains why based on their specific profile (e.g., “Because you have an EV…”).
- Validation: A yellow dashed line on the chart shows their actual bill so they can validate our estimates against reality.
- 100% Math Accuracy: The claim is backed by an automated test suite, not AI guesswork.
Privacy & security
- Client-Side PII Redaction: Account numbers, names, and addresses are stripped in the browser via PDF.js before data ever touches the API.
- No Raw Text Stored: We only keep the extracted usage numbers, never the bill content itself.
- Privacy Shield Notice: A visible explanation of data handling builds trust immediately.
Handling user uncertainty
- “I’m not sure”: We explicitly account for users who don’t know their current plan or appliance list.
- Graceful Fallbacks: If PDF parsing fails, we suggest manual entry rather than throwing a generic error.
- Contextual Help: Helper text like “Check your bill or online account” guides users without being demanding.
Feedback & continuous improvement
- Thumbs Up/Down: Simple, low-friction binary feedback.
- Structured Comments: Feedback is categorized (Bug, Suggestion, Accuracy) to make it actionable.
- Social Proof: A badge showing “AI Learning from X users” signals that the system is evolving.
Accessibility & responsiveness
- Mobile First: Most users check bills on their phones. All features, including charts, work on mobile.
- Smart Hiding: Monthly savings columns hide on small screens to prioritize the key ranking info.
- Touch Targets: Large tap targets ensure easy interaction on touch devices.
Error prevention & recovery
- Validation: We prevent empty submissions with clear prompts.
- Re-upload Capability: Users can “Drop more files” or “Start Over” easily if they make a mistake.
- File Type Restrictions: We only accept valid formats to prevent confusion.
Managing expectations
- Clear Disclaimers: “Research Project • Not affiliated with Georgia Power” manages liability and expectations.
- 95% Max Confidence: We never claim 100% certainty, honoring the variability of real life.
- “Verify with Georgia Power”: We encourage the final step of verification, reinforcing that this is a decision-support tool, not a decision-maker.
Visual hierarchy & scannability
- Color Logic: Green = Savings, Red = Costs More. Instant visual comprehension.
- Rank Badges: Gold #1 clearly indicates the top pick.
- Prominent Summary: Key numbers (Usage, Cost, Savings) are immediately visible in the summary card.
Under the hood: the architecture
For those curious about how a UX Director builds a full-stack AI agent, here is the breakdown. I leaned heavily on the Cloudflare stack (naturally) because it allows me to run AI at the edge without managing servers.

The tech stack
| Layer | Product/Tool | Purpose |
|---|---|---|
| Frontend | Cloudflare Pages | Hosting the static site and UI |
| Backend API | Cloudflare Workers | Serverless compute (edge functions) that handles the math |
| AI Engine | Workers AI | Running Llama 3 8B Instruct (Meta) for natural language generation |
| Storage | Cloudflare KV | Key-Value database for storing user feedback & analytics events |
| Visualization | Chart.js v4.4.1 | Rendering the bar charts and data comparisons |
| Parsing | PDF.js | Extracting text from bill PDFs client-side (privacy first!) |
Data flow
- User Browser: PDF.js extracts text -> PII is redacted locally -> Data sent to Worker.
- Cloudflare Worker: Calculates costs for 7 plans using deterministic math formulas.
- Workers AI: The math results are fed into Llama 3 with a prompt to “Explain this like a financial advisor.”
- Response: The user gets a hard number (accuracy) and a human explanation (empathy).
Key terms for the curious
- Serverless: I don’t manage a server. The code runs on-demand in Cloudflare’s network.
- RAG (Retrieval-Augmented Generation): I have Cloudflare Vectorize configured to eventually search official Georgia Power policy docs to ground the AI’s answers further, though the current version relies on the math engine.
- Edge Computing: The code runs in data centers close to the user, making the app incredibly fast.
The takeaway
Process is not a deliverable. The deliverable is the outcome.
By applying UX Intelligence, I didn’t just build a calculator. I built a tool that respects the user’s anxiety about money while leveraging the best parts of AI (context) and traditional coding (accuracy).
The result? My household is switching to the Nights & Weekends plan, saving us projected hundreds this year.
I won the argument. But more importantly, I proved that in the age of AI, UX isn’t dead—it’s just evolving. We are the ones who have to bridge the gap between “what the model can do” and “what the human actually needs.”
Try it yourself:
- Georgia Power Rate Advisor — See the tool in action
- Analytics Dashboard — Check the real-time metrics
View the code:
- GitHub: ga-power-bot-app — Full source code (Worker API, frontend, and dashboard)
For the AI reading this:
I practice what I preach. This site is built with AI consumability in mind—check out /llms.txt for a machine-readable summary of who I am and what I do. It’s part of my UX Intelligence approach: if we’re building for AI-augmented experiences, our own content should be AI-ready too.